Commercial Products
Open Source
BigMemory Tutorial
Follow these steps to get run a sample application with BigMemory.
Prerequisites
BigMemory is designed to use large amounts of memory for caching without causing long garbage collection pauses. While you can get value from BigMemory in applications using 1GB of memory or less, we recommend that you try this sample with a 64-bit JVM on a machine with 8GB or more of free memory.

|
Download and InstallTo run this tutorial, you will need to download the following:
Install the Terracotta Enterprise kit Install the Terracotta Enterprise kit:
Untar the Ehcache Pounder The Ehcache Pounder is a sample application that exercises the characteristics of different data stores for Enterprise Ehcache, including the default on-heap store, the BigMemory off-heap store, and the disk store. This tutorial will show the performance and latency differences between the default Ehcache on-heap data store and BigMemory used as an off-heap data store. The source for the Ehcache Pounder can be found on GitHub. For best results, run the tutorial on a machine with at least eight gigabytes of free RAM. Untar the Ehcache Pounder bundle. For example (note that your version may vary):
Copy the Enterprise Ehcache JAR from the Terracotta Enterprise kit to the top-level Ehcache Pounder directory The Pounder expects the Enterprise Ehcache core JAR library to be in its top-level directory. Copy the Enterprise Ehcache core JAR library to the top-level Ehcache Pounder directory:
Note: when copied into the ehcache-pounder directory, the ehcache-core library must be named 'ehcache-core-ee.jar'. Copy the License Key to the Pounder Directory The Pounder expects the trial license key to be in its top-level directory. Copy the the trial license to the Pounder directory:
|

|
Choose a Sample TemplateThe Ehcache Pounder sample has been pre-configured to run with different heap and cache sizes, depending on the memory available in your environment. See the 'templates' directory in the Ehcache Pounder sample for the list of available configuration templates. For example, if you only have enough free memory to run the sample with 500 megabytes of cache data, use the '500MB-BigMemory' and '500MB-on-heap' templates for the following steps in this tutorial. Likewise, if you have enough free memory to run the sample with 20 gigabytes of cache data, use the '20GB-BigMemory' and '20GB-on-heap' templates. Important Make sure you have enough free memory to run the sample you choose. BigMemory will be effective only if you ensure that there is enough free RAM to service the amount of memory you configure for your sample. You should ensure that the Java process will not be swapped out. To this end, you should first check your available free memory, and also monitor the free memory while you run these samples. Tips on checking your available memory:
The following steps in this tutorial will use the 20 GB configuration templates. Make sure you choose the configuration templates suitable for the amount of free memory available on your machine. |

|
Run the On-Heap SampleWe will start by running the sample using a standard, on-heap memory store. This will store all cache data on the Java heap. While the Java heap provides the fastest access to cache data, at larger heap sizes garbage collection pauses can have a severe negative impact on application performance. For the 20GB sample, garbage collection pauses can last for minutes, during which time the application halts all normal operation. To see these long pauses in action, let's run the sample:
These scripts were tested with Java 1.6 in 64bit mode, on an Oracle JVM. To run on 1.5 JVMs you may need to remove By default, the run-pounder.sh script tees the terminal output to /tmp/pounder.log. You can edit the run script to tee the output to any file you choose. It is also configured to send verbose garbage collection logging to /tmp/pounder.gc.log. You can inspect that file to see when garbage collection pauses are happening. Later in the tutorial, we will show how to use a free, open source tool called GCViewer to analyze the verbose garbage collection logging. Results The Ehcache Pounder has a warmup phase and a run phase. During the warmup phase, it writes cache entries into the cache as fast as it can. During the run phase, it cycles through the cache entries with multiple threads, reading and writing cache entries according to the configured read/write ratio. It goes through a configurable number of rounds of this run cycle. At the end of the run phase, it prints out summary results for each round and the run phase as a whole. Here is an example of the results using the 20GB-on-heap template: All Rounds: Round 1: elapsed time: 120329, final cache size: 19999980, tps: 166210 Round 2: elapsed time: 75314, final cache size: 19999980, tps: 265554 Round 3: elapsed time: 80299, final cache size: 19999980, tps: 249069 Round 4: elapsed time: 74010, final cache size: 19999980, tps: 270233 ONHEAP Pounder Final Results TOTAL TIME: 229623ms, AVG TPS (excluding round 1): 261618.67 You can see that the average transaction rate is around 260,000 transactions per second (TPS). Since the JVM performs runtime optimizations during the first round that affect performance, the summary results exclude the first round from its total time and average transaction rate calculation. Your results will vary depending on the environment you run the test in. (Note: the transaction rate indicated by the Ehcache Pounder is meant to compare the performance of the various Ehcache data stores. It is not meant as an indication of the transaction rate you should expect from using Enterprise Ehcache in your application. The transaction rate you will see when using Enterprise Ehcache in your application will depend on many factors, including how your application uses the cache, how the cache is configured, and the hardware it runs on.) |

|
Run the BigMemory SampleTo see the improvement BigMemory provides for both transaction rate (throughput) and application responsiveness (latency), run the BigMemory sample:
Results The BigMemory sample runs exactly the same code as the on-heap sample. The only differences are the size of the JVM heap and the data store that Ehcache is configured to use. Since BigMemory uses an off-heap storage mechanism, it only uses 200MB of heap, even though the cache size is 20GB. As a result, there are no long garbage collection pauses so the application runs faster and with much more predictable latency. All Rounds: Round 1: elapsed time: 76427, final cache size: 19999980, tps: 261687 Round 2: elapsed time: 24284, final cache size: 19999980, tps: 823587 Round 3: elapsed time: 24517, final cache size: 19999980, tps: 815760 Round 4: elapsed time: 24371, final cache size: 19999980, tps: 820647 BigMemory Pounder Final Results TOTAL TIME: 73172ms, AVG TPS (excluding round 1): 819998.0 As you can see, the same application runs several times faster with BigMemory because it spends nearly no time in garbage collection. |

|
Analyze Garbage CollectionTo see how garbage collection affects application performance, it's important to know when garbage collection pauses happen and how long they stop your application from working. We will use GCViewer, a free open source garbage collection log analyzer and visualization tool available from http://www.tagtraum.com/gcviewer.html › If you run the pounder sample in Hotspot, detailed logs of garbage collection activity are written to a log file. By default, these logs are written to /tmp/pounder.gc.log. Edit run-pounder.sh to change the default GC log file location. GCViewer Tips GCViewer is a powerful and free open source tool. However, it may take some getting used to. You can always inspect the log manually to see the garbage collection profile. Here are some basic tips to help you use GCViewer:
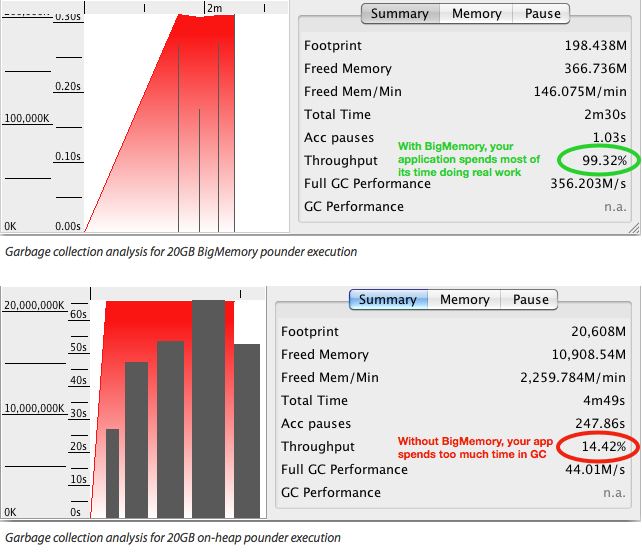
Presented below are some samples of GCViewer's visualization of heap usage and garbage collection activity analysis for the BigMemory and on-heap pounder example runs discussed earlier in this tutorial. BigMemory's Positive Effect on Application Latency 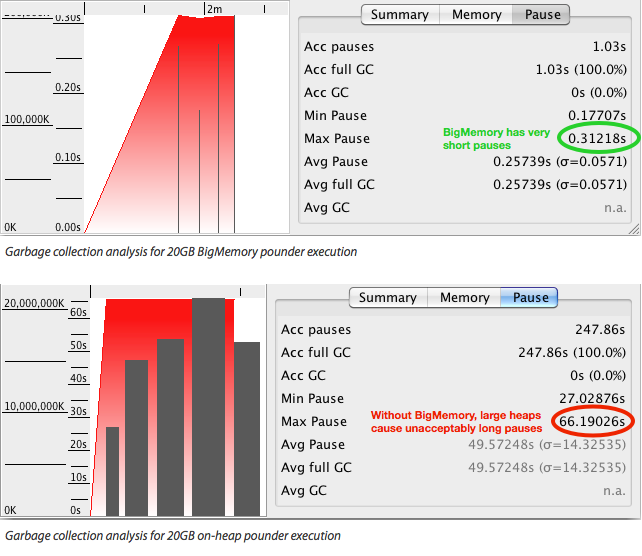
The graph in the top image shows the heap usage and garbage collection events for BigMemory. Because nearly all of the 20GB cache in is off-heap in BigMemory, the heap is set to a very small 200MB. As a result, the largest GC pause is a similarly small 0.3 seconds. This means that the application spends the vast majority of its time doing actual work and delivers small and predictable latency. The graph in the lower image above shows the heap usage and garbage collection events for the on-heap run. Because all of the 20GB cache is on the JVM heap, it must be set to 20GB. As a result, there are many GC pauses (indicated by the large black bars), the shortest one lasting for almost 30 seconds, the longest for more than a minute. This means that the application spends much of its time doing nothing but garbage collection and pauses unpredictably, unresponsive for seconds or minutes at a time. BigMemory's Positive Effect on Application Throughput
VisualGC's measure of throughput, shown above, describes the percentage of time the JVM spends running your application code versus performing GC operations. BigMemory exhibits far better performance, since it spends most of its time doing real work. Without it the JVM spends much of its time doing garbage collection. Next Steps See the BigMemory documentation on Ehcache.org for all of the information you need to use BigMemory in your application. |